Analytics for publishers
The first release of the publisher analytics tracks and reports sales and user behaviour data. The available report helps you better understand the performance of your assets and make informed business decisions.Glossary
Sales
Gross Asset Store sales before deduction of taxes and your payment under Section 4 of the Asset Store Provider Agreement.
Conversion rate
Conversion rate is the Sales quantity divided by the number of Pageviews. For free assets, conversion rate is calculated as the number of times an asset is added to My Assets divided by the number of Pageviews.
Sales quantity
The number of sold asset licences, e.g. when a customer buys 3 seats for one asset the Sales qty number is increased by 3. For a free asset, sales quantity equals to the number of times users add it to My Assets.
Pageviews
The number of times your product pages were viewed. The report does not aggregate data in unique pageviews, e.g. if one user visits your asset twice within a session, it adds two new pageviews.
Downloads
The number of times your assets were downloaded from the Asset Store. The report does not aggregate data in unique downloads, e.g. if one user downloads your asset twice within a selected time period, it adds two new downloads. Downloads do not represent the number of purchases for the paid assets as users do not always download packages right after the purchase, or they may download the same package multiple times.
Wishlisted
The number of times your assets were added to lists by Asset Store users.
Refunds
The number of approved refund requests.
Average rating
The average asset rating over the selected time period.
Filtering
Filter by assets
With the assets filter, you can define which assets are included in the report: all assets, a group of assets or a single asset.
Filter by dates
The date filter includes few presets and allows you to pick custom date ranges. The maximum range is limited to 1 year, and the earliest available date is 1 Jan 2019. For historical data, please visit individual sales, revenue and downloads reports.
Data display
Line chart
Line chart visualises the change of selected metrics over time. You can change primary and secondary metrics by using the dropdowns on top of the chart. The chart’s Y-axis holds the primary metric values on the left and secondary metric values on the right hand side. The X-axis values are defined according to the selected date range.
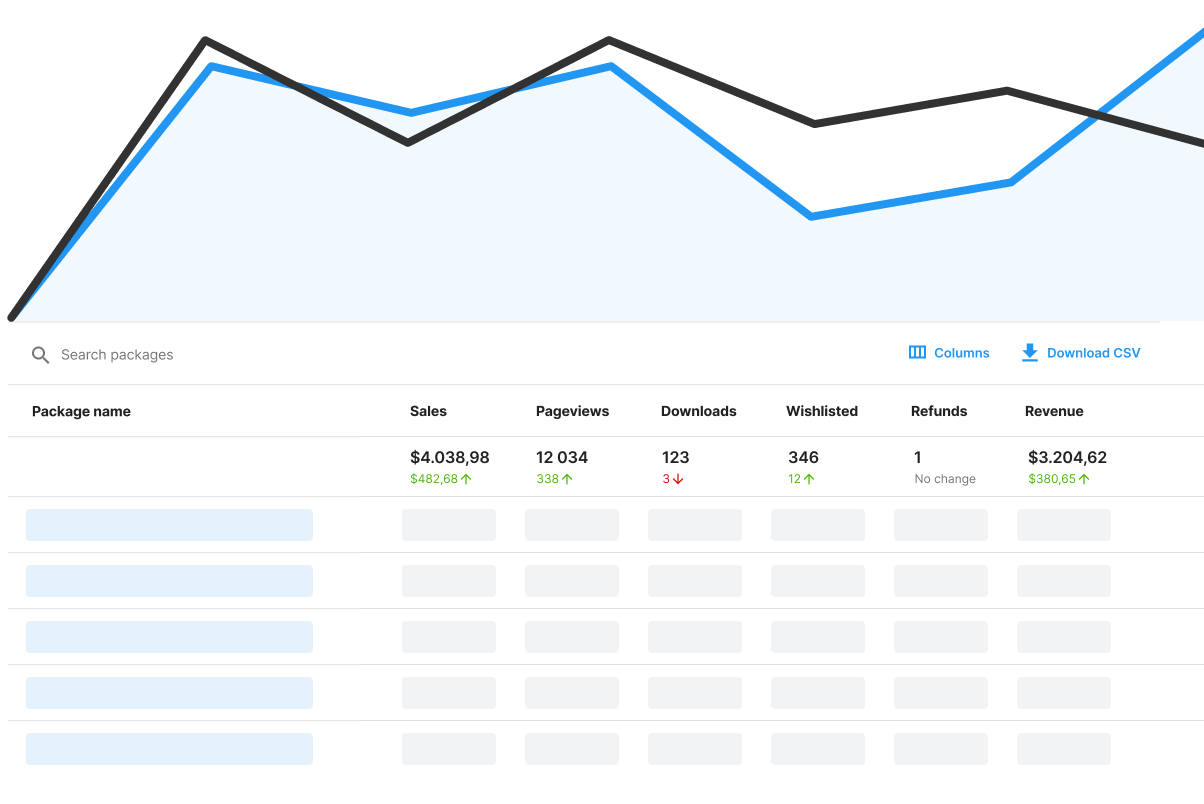
Change over time
The change over time shown in green or red text next to the total values is defined on the basis of the date range selection: e.g. when you select Last 7 days (e.g. 8 May – 14 May 2021), the change over time value refers to previous 7 days (e.g. 1 May – 7 May 2021).
Search
By typing in the asset name you can narrow down the range of assets shown in the table. Kindly note, the search does not affect the line chart: to see the data visualisation for specific assets you need to use the asset filter above the chart.
CSV download
To download a data set displayed in the table, use the Download CSV button next to the search field.